 As the year draws to an end it’s a good time to review things. Over the last day or so I’ve been exploring our social media activity and “performance”.
Social media is important to any business these days, but without doing some level of analysis on a number of metrics it’s kind of pointless. Sure, you can tweet and share content all day every day, but unless you can do some level of tracking it’s going to be hard to see any real return on investment (ROI). In the case of “social” ROI is something that people argue about all the time. Obviously for any business a key factor is going to be sales. No sales = no business. But it’s not simply a matter of sales volume, it’s also things like “reach”, “audience” and other factors.
Over the past couple of years we’ve been experimenting with social media quite a bit.
We’ve got accounts on most of the major social media outlets, though, admittedly, we aren’t using some as actively as we could. Others simply haven’t “taken off” and probably aren’t worth investing time and money into in the future (for example app.net).
At the moment we have this blog, our status site (which includes a blog, as well as a server status dashboard) our Twitter account and Facebook page that we actively maintain and use. We’ve also got the technology.ie blog and podcast, our Instagram account, Pinterest, Google+ as well as YouTube.
We use social media in a number of different ways.
Our customer service teams are able to respond to users’ direct messages on Twitter or posts on our Facebook page, as our helpdesk is hooked directly into both social media channels. If there are any service affecting issues our technical team will post and update our status site and our staff will try to update customers via our Twitter account as quickly as they can.
Posts from three of our sites are shared via Twitter and Google+ ie. this blog, our status site and technology.ie.
We also post some of the articles from the various blogs to our Facebook page, but we tend to that manually these days, as it gives us more control over how the content displays and we can make use of the longer form, as well as being more selective about which content to post and when.
So what kind of data can we look at?
There’s a number of tools out there that help to analyse all sorts of metrics related to social media. Some are free, some are paid. We use a mixture of both free and paid services to both manage our social media activity and analyse it.
Tools We Use (in no particular order):
So what can we see?
Sprout Social’s reports give us a nice overview of our “follower” demographics. What’s interesting here is that there’s a significant difference between our Twitter followers and our Facebook “fans”:
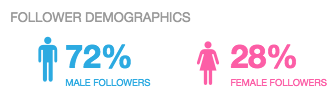
Twitter demographics
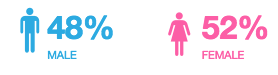
Facebook demographics
We don’t do any gender targeting on either network, so I’ve no idea why the split has ended up like this. One possible explanation is that the data for Facebook is more accurate, while Twitter numbers would also include company accounts, which might be tagged as female (?). Only a theory…
Both Facebook and Twitter give you quite a bit of data about how people are interacting with your content. Poking around the engagement numbers is always a fascinating exercise. From what we’ve seen people tend to respond more to “fun” stuff than the more sombre and “business” type posts that would (hopefully) generate business.
So posting a “silly” graphic or photo might get plenty of engagement, but probably won’t convert to actual sales.
But are sales the only metric we’re interested in?
Based on what we’ve seen I’d say not.
Being able to respond to users’ queries quickly and keep them updated on service issues is probably more “valuable” in terms of customer value. In this context “value” is very much a two way street. We get valuable feedback and input from users, while we endeavour to provide them with timely service.
Of course all of that is totally pointless if none of your users are actually following or engaging with your Twitter account or Facebook page. While some people might like to argue that follower numbers are meaningless, that’s not entirely true. If none of our users knew to check Twitter then there’d be little point in maintaining an active Twitter account, for example.
Our follower pattern shows fairly consistent growth and we also try to “follow back” where possible (apart from anything else direct messages (DMs) wouldn’t work)
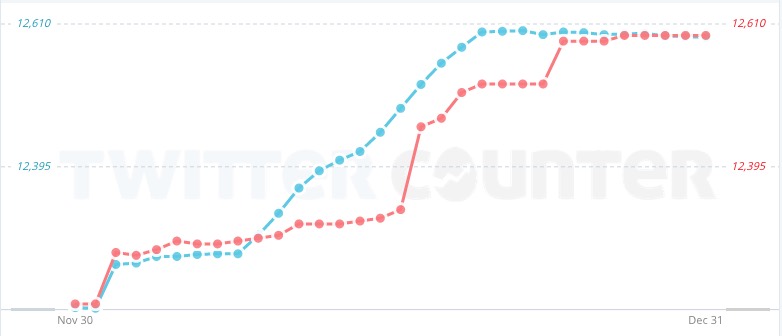
Blacknight Twitter follower numbers over 90 day period
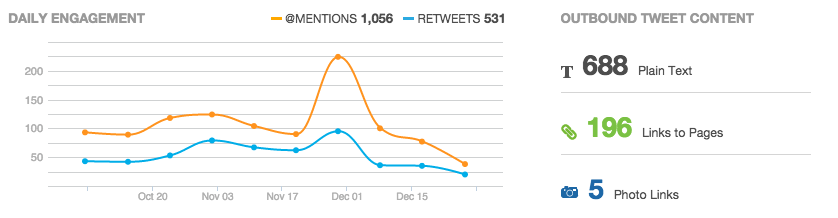
Interactions and other types of engagement are a good indicator to see if anyone is actually interacting with us (obviously).
You can get data directly from Twitter’s own analytics dashboard even if you aren’t an advertiser. Other tools can help present the data in a more useful fashion, so pulling up a couple of reports from Sprout Social’s dashboard gives me something I can decipher quickly:
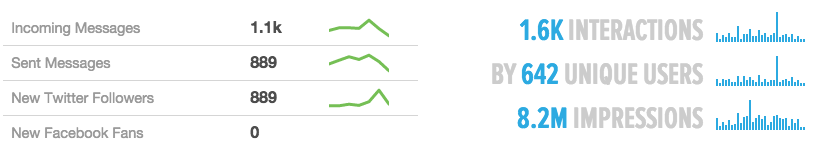
With “incoming” being higher than “sent” it’s clear that we aren’t purely “broadcasting”, which is a good thing.
Twitter’s own stats for the same period present the data differently and also gives quite different numbers.
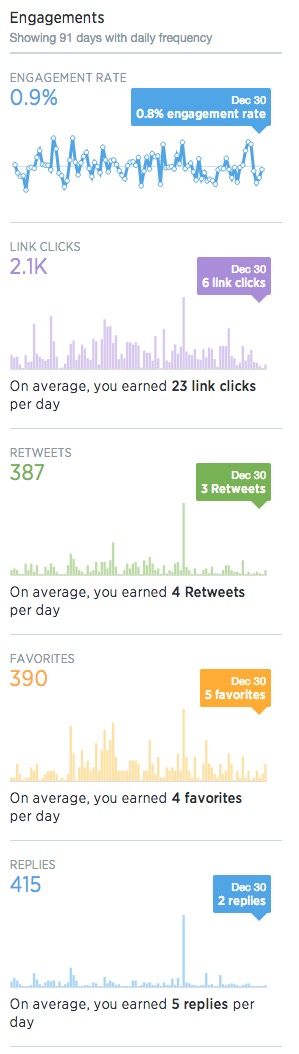
Twitter shows the various types of “engagement”
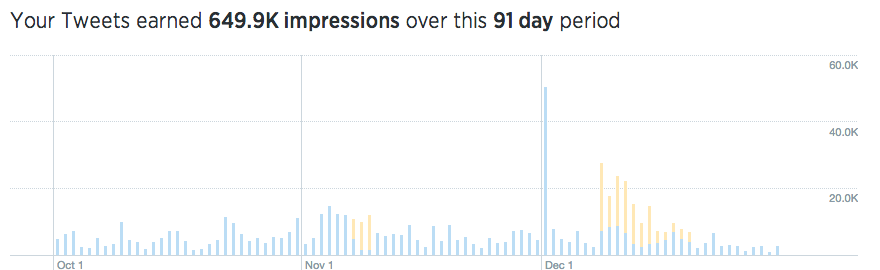
Twitter’s analytics breakdown over a 91 day period
Taking any of those statistics by themselves might be interesting, but where it gets useful is when you use some of the comparison tools that Sprout Social and others provide ie. how your accounts are doing compared to your competitors. On a regular basis we compare our social stats with those of other companies in our industry vertical, both in Ireland, Europe and worldwide to see how we’re doing.
The final metric, and possibly the most interesting, is to see how well our content is doing in terms of “sharing”.
Content posted on our company blog was shared quite a bit over the last 12 months primarily on Facebook:
Top Pieces of Content for “blacknight.com”
Total Shares: 315
Total Shares: 276
Total Shares: 269
Total Shares: 254
Total Shares: 206
We also publish quite a bit of content on technology.ie, so what performed well over there?
Top Pieces of Content for “technology.ie”
Total Shares: 384
Total Shares: 297
Total Shares: 274
Total Shares: 247
Total Shares: 211
Armed with all of this data we can then decide what we need to focus on and improve over the next few months.
We will continue to experiment with different types of content on the main social networks, though I suspect we’ll be focussing most on Facebook and Twitter again in 2015. That might change, as we try out different things and we also plan to hire more staff to work in our marketing team.
Advertising on social networks is growing and we’ll probably invest more in it in 2015 than we did in 2014.
Here’s to 2015!